Grafana Dashboard
Prerequisites
First install Grafana and Prometheus on your machine.
You can also use Grafana Cloud instead of installing it locally.
Enable metrics
To enable metrics, you'll have to modify the CLI arguments of your node and farmer by adding the Prometheus option:
for a node:
--prometheus-listen-on 127.0.0.1:9080
for a farmer:
--metrics-endpoints 127.0.0.1:9081
To apply the changes, it's necessary to restart your node and farmer. You should then have the capability to reach the metrics at http://localhost:9080 and http://localhost:9081.
Configure Prometheus targets
Locate the prometheus.yml file and add the following job entry under the scrape_configs section:
- job_name: "subspace"
  static_configs:
    - targets: ["localhost:9080"]
      labels:
        group: 'node'
    - targets: ["localhost:9081"]
      labels:
        group: 'farmer'
On Linux machines, you can typically find the prometheus.yml file at the following path: /etc/prometheus/prometheus.yml
Restart Prometheus with the new configuration.
Prometheus can reload its configuration without restarting by using the SIGHUP signal. If you're running on Linux this can be performed by using kill -s SIGHUP <PID>, replacing <PID> with your Prometheus process ID.
Configure Grafana
By default, Grafana usually runs on port 3000. You can access Grafana by navigating to the following URL: http://localhost:3000.
The default username and password is admin.
Add your Prometheus Data Source:
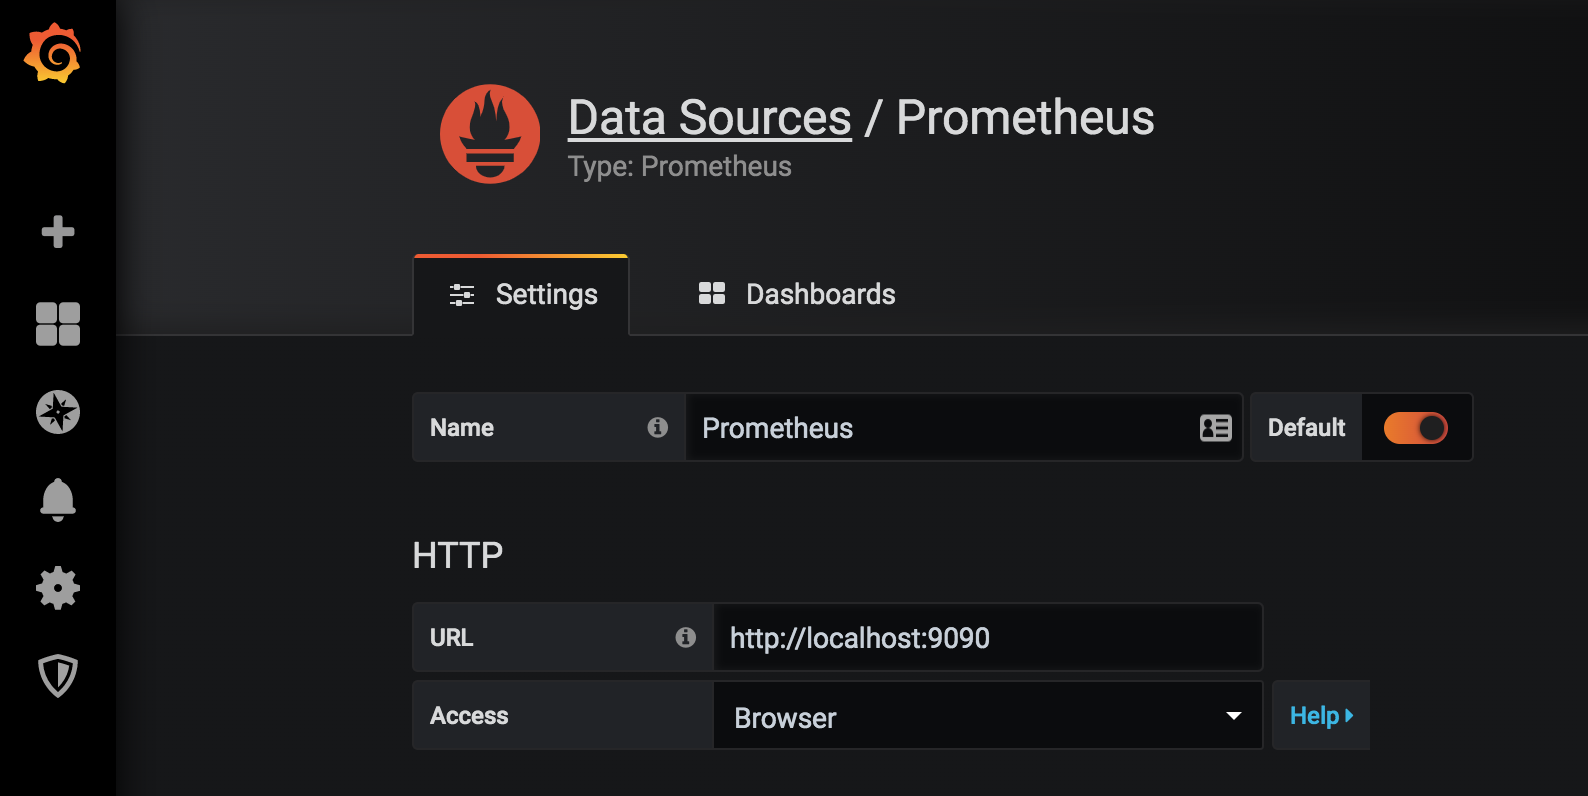
Click Save & test to test the configuration, if everything is alright you'll see the green message "Data source is working".
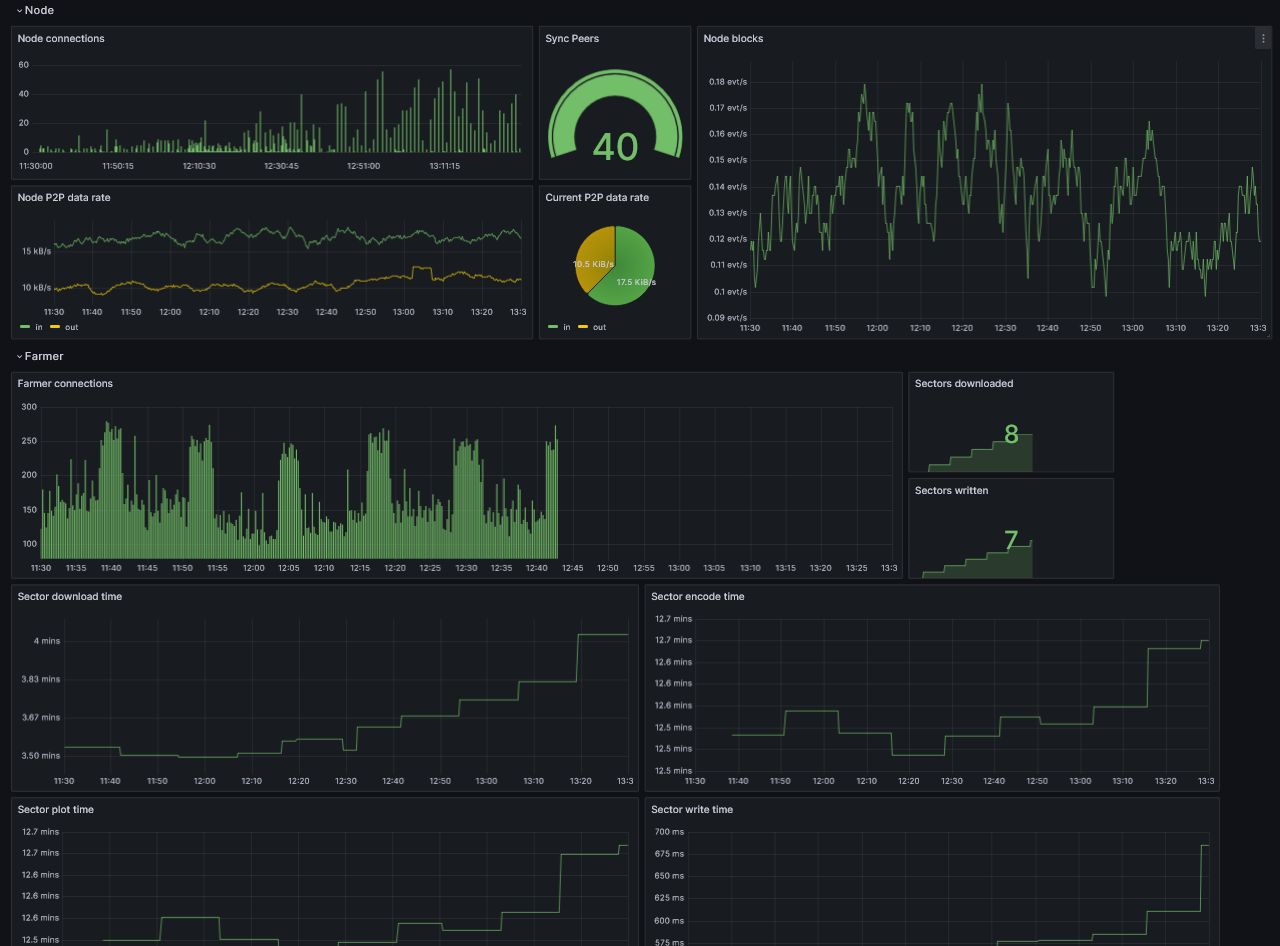
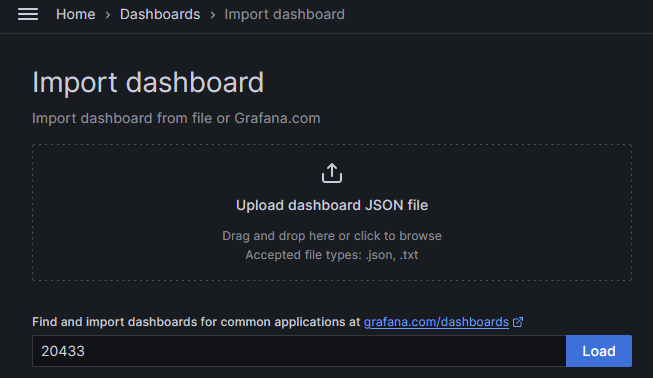
Import Grafana dashboard
Copy and paste the Grafana Dashboard ID 20433 and click Load to complete importing:
Select your Prometheus as Data Source and click Import.
At this point, you should be able to monitor your node.